¶ Description
Create a custom chart from scratch to visualize your most important data at a glance
¶ Chart types

¶ Counter

This type of chart is recommended to quickly consult critical data during your daily follow-up (e.g revenue, inventory, streams).
It works with one data source and one or more filters but no dimensions.
¶ Pie chart

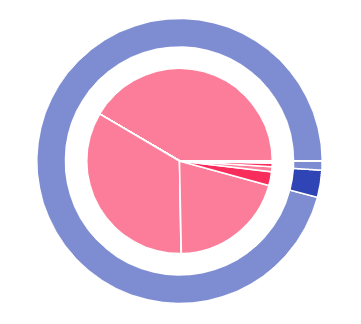
The pie chart allows you to visualize the distribution of data according to the dimension you have selected (e.g by player type, by device).
The recommended use is to track one or two metrics to each dimension. (e.g inventory and impressions by device)
¶ Curve

The curve graph recommended to track the performance of data over time.
The recommended use is to add up to 3 data sources to follow track the performance of each source (e.g impressions, inventory, revenue) on the same graph or to track a data source with a dimension (e.g impressions by device)
¶ Histogram
The histogram is recommended to compare several data sources associated with the same dimension

¶ Environment
Select here the desired advertising environment and user type

¶ Ad Environments
Outstream (ad formats without video content)
Instream (ad formats followed by video content)
All
¶ Universe
Publisher (the report will focus on your activity as a site)
Producer (the report will focus on your activity as a video producer)
All
¶ Period
Select the period you want to analyse

- Custom
- Yesterday
- Last 7 days
- Last week
- Last 15 days
- Last 30 days
- Last month
- Current month
¶ Custom
Allows you to select a period between two specific dates using a calendar.
¶ Granularity
¶ Description
Select the time granularity you want for your report.
None (consolidated figures for the whole period)
Day (one row of numbers per day)
Month (one row of numbers per month)
¶ Data
Select the data that will be used as the basis for the creation of the graph.
Data Player
Trigger rate (%)
Player inventory
Player HAB Inventory
Adblock Rate
Monetization data
Calls to ad tags
Ad impressions
HAB fill rate (%)
Revenues (estimated) /£/£/£/£/£/£/£/£/£/£
Average CPM (estimated)
Advertising performance
Visibility(IAB)
Ad Completion 25% (IAB)
Ad Completion 50% (IAB)
Ad Completion 70% (IAB)
Ad Completion 100% Complete
Complete Visible (%)
Click-through rate (%)
Ad Skips (%)
Video performance
Streams
Video Completion 25
Video Completion 50
Video Completion 75
100% Video Completion
Cumulative viewing time (h)
Average completion rate (%)
¶ Dimensions
Dimensions allow you to add a level of granularity to the charts you generate.

User Environment
Adblock
IP Country
Device
OS
Browser
Environment Player
Site
Zone
Company
Player type
Video theme
Catalog
Video length
Advertising environment
Control room
¶ Video Environment
Video
¶ Filters
The filters allow you to limit the data displayed according to the following parameters :
Function not essential to start visualizing your graphic data
Companies / Sites / Zones
Companies/ Catalogues
Regies
Player type
Video theme
Ad format
Preroll
Postroll
Overlay
OS
Device
Browser
Adblock
Video length
IP Country
The options
Once you have created your chart, you will be able to:
¶ Edit
Share
Duplicate
Delete
Edit
This option allows you to resume editing your document
¶ Share
This option allows you to share your graphic with one or more recipients
¶ Duplicate
This feature allows you to duplicate a document; your duplicated document will be a copy of the original. We advise you to duplicate any documents shared with you to avoid losing it if the owner deletes the original shared file.
¶ Delete
This option allows you to delete your document. Deleting a document being shared with one or more recipients will automatically delete the document on their accounts.
¶ Export file

¶ Description
Once you have viewed the graphic, you can click on the "export" button to save a copy on your computer in PNG format
¶ Save
Once you have visualized your graph, save it so that you can find it at any time in your My Graphs section.